An Interactive Map of Every Cargo Ship in the World in 2012

Using over 250 million data points from the UCL Energy Institute (UCL EI), Kiln, a London-based data visualisation and digital journalism studio, created the incredible interactive map embedded below.
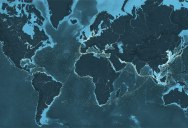
The map displays movements of the global merchant fleet over the course of 2012, overlaid on a bathymetric map. You can also see statistics such as a counter for emitted CO2 (in thousand tonnes) and maximum freight carried by the represented vessels (varying units).
The merchant fleet is divided into five categories, each of which has a filter and a CO2 and freight counter for the hour shown on the clock. The ship types and units are as follows:
– Container (e.g. manufactured goods): number of container slots equivalent to 20 feet (i.e. a 40-foot container takes two slots)
– Dry bulk (e.g. coal, aggregates): combined weight of cargo, fuel, water, provisions, passengers and crew a vessel can carry, measured in thousand tonnes
– Tanker (e.g. oil, chemicals): same as dry bulk
– Gas bulk (e.g. liquified natural gas): capacity for gases, measured in cubic metres
– Vehicles (e.g. cars): same as dry bulk
To see a full screen version of the map embedded below visit www.shipmap.org. You can also find some additional information on the map below.
[via Digg]
Why do ships sometimes appear to move across land?
In some cases this is because there are ships navigating via canals or rivers that aren’t visible on the map. Generally, though, this effect is an artefact of animating a ship between two recorded positions with missing data between, especially when the positions are separated by a narrow strip of land. We may develop the map to remove this effect in the future.
Why are there fewer ships visible in the first part of the year?
Unfortunately the data we are using for the map is incomplete for the first few months of the year: roughly January to April.
How was the map created?
UCL EI took data showing location and speed of ships and cross-checked it with another database to get the vessel characteristics, such as engine type and hull measurements. With this information they were able to compute the CO2 emissions for each observed hour, following the approach laid out in the Third IMO Greenhouse Gas Study 2014. Kiln took the resulting dataset and visualized it with WebGL on top of a specially created base map, which shows bathymetry (ocean depth), based on the GEBCO_2014 Grid (version 20150318), as well as continents and major rivers from Natural Earth.
Where did you get the data and who paid?
Our data sources for shipping positions are exactEarth for AIS data (location/speed) and Clarksons Research UK World Fleet Register (static vessel information). We are very grateful to our funders, the European Climate Foundation.