September 10, 2018 at 12:48 pm
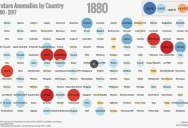
Temperature Anomalies by Country from 1880-2017

Using NASA GISTEMP data, Antti Lipponen, a research scientist at the Finnish Meteorological Institute, created this fascinating data visualization that shows temperature anomalies by country from 1880-2017.
Trending on TwistedSifter